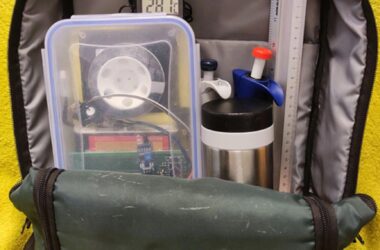
Une visualisation des mesures de la vapeur d’eau atmosphérique effectuées par l’instrument AIRS autour du globe. Crédit : NASA/JPL-Caltech/AIRS
;” data-gt-translate-attributes=”[{” attribute=””>NASA satellite data illuminates a critical relationship between low humidity and the outbreak of flu in the U.S.
What triggers an outbreak of the influenza virus? A new study of the flu in the 48 contiguous U.S. states, using data from the Atmospheric Infrared Sounder (AIRS) on NASA’s Aqua satellite, has found that the answer is closely tied to local weather – specifically, to low humidity – and varies from state to state.
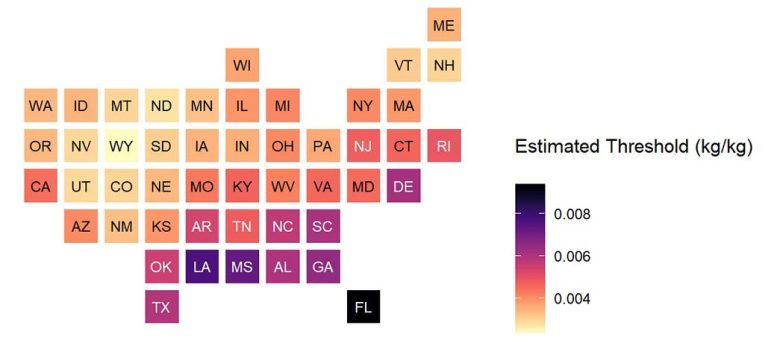
This chart shows low-humidity thresholds that signal flu outbreaks in 48 U.S. states. The color range from lighter to darker indicates lower to higher humidity thresholds, with the driest state, Wyoming, having the lowest threshold and Florida the highest. Units are kilograms of water per kilogram of air. Credit: NASA/JPL-Caltech
Average humidity varies widely across the United States, but even in the most humid states, it begins to drop as winter approaches. Researchers at NASA’s Jet Propulsion Laboratory in Southern California and the University of Southern California correlated AIRS measurements of water vapor in the lower atmosphere with flu case estimates for each week from 2003 to 2015. The researchers found that in each state, there is a specific level of low humidity that may signal a flu outbreak is imminent. When this threshold is crossed each year, a large increase in flu cases follows within two or three weeks, on average.
Une visualisation des mesures de la vapeur d’eau atmosphérique de l’instrument AIRS autour du globe pendant quelques mois de l’étude sur la grippe, qui s’est concentrée sur les données de 2003 à 2015. AIRS se trouve sur le satellite Aqua de la NASA. Crédit : NASA/JPL-Caltech/AIRS
Ces seuils de faible humidité correspondent étroitement au climat moyen de chaque État. Bien que les 48 États aient tous des seuils différents, les États au climat humide, comme ceux du Sud-Est, ont des valeurs seuils plus élevées que les États arides, notamment ceux de l’Ouest et du Sud-Ouest.
L’étude n’a pas été conçue pour répondre à la question de savoir pourquoi une faible humidité conduit à des épidémies de grippe.
Référence : “Spatial Variation in Humidity and the Onset of Seasonal Influenza Across the Contiguous United States” par E. Serman, H. Th. Thrastarson, M. Franklin et J. Teixeira, 13 décembre 2021, GeoHealth.
DOI : 10.1029/2021GH000469